

Chaindson Suite

Visualize KPIs such as inventory coverage and transport data to create cost transparency
The Chaindson Suite is an intelligent tool that visualizes KPIs such as inventory coverage and transport data, making cost structures transparent, helping to analyze logistics costs and identify optimization potential. Because cost optimization and even cost pressure are key challenges across all industries.
The Chaindson Suite can support you quickly and cost-effectively in implementation, because it offers:
- Independent of IT systems
- Utilization of existing data
- Clear, proven project methodology
- Very short implementation phase
- Low resource requirements on your side
Do you know your logistics cost categories and their amount and distribution?
The majority of companies hold significantly higher inventory levels than necessary.
Are your logistics service invoices transparent and verifiable?
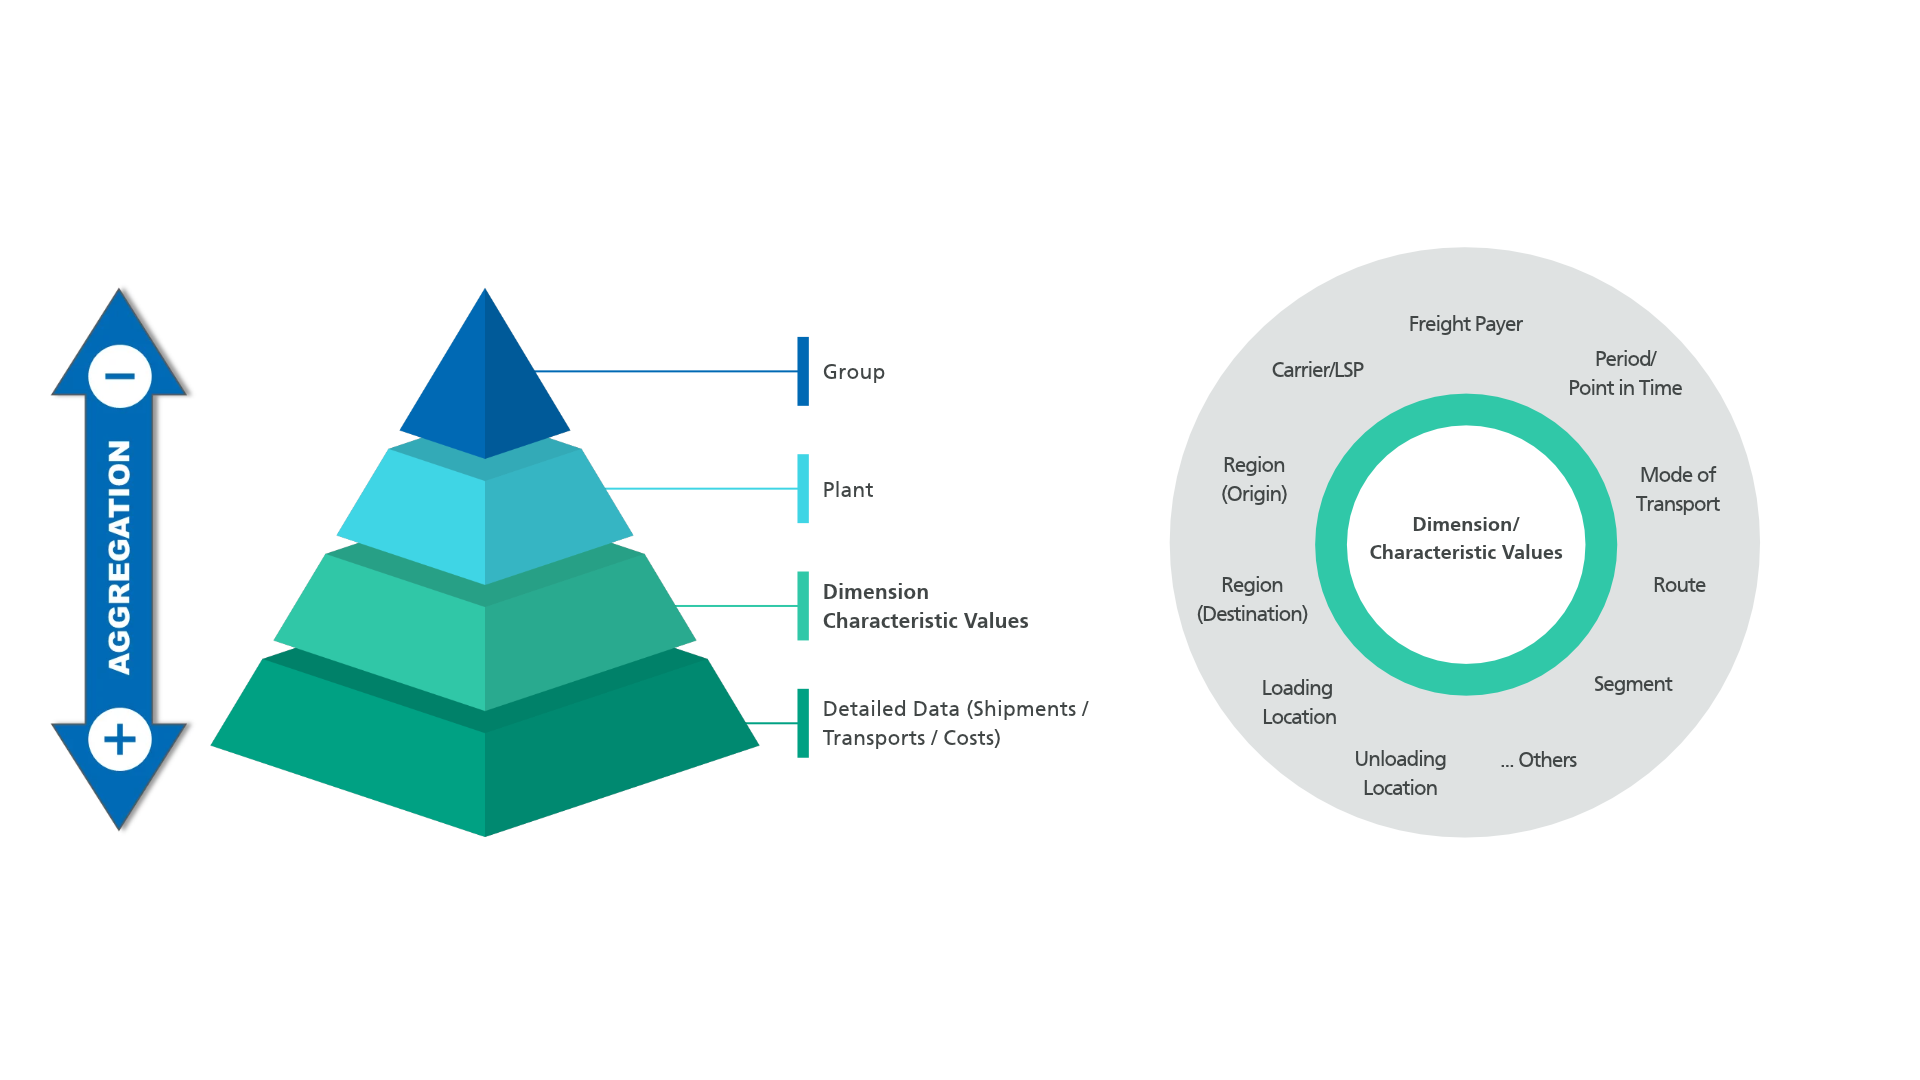
Transport data
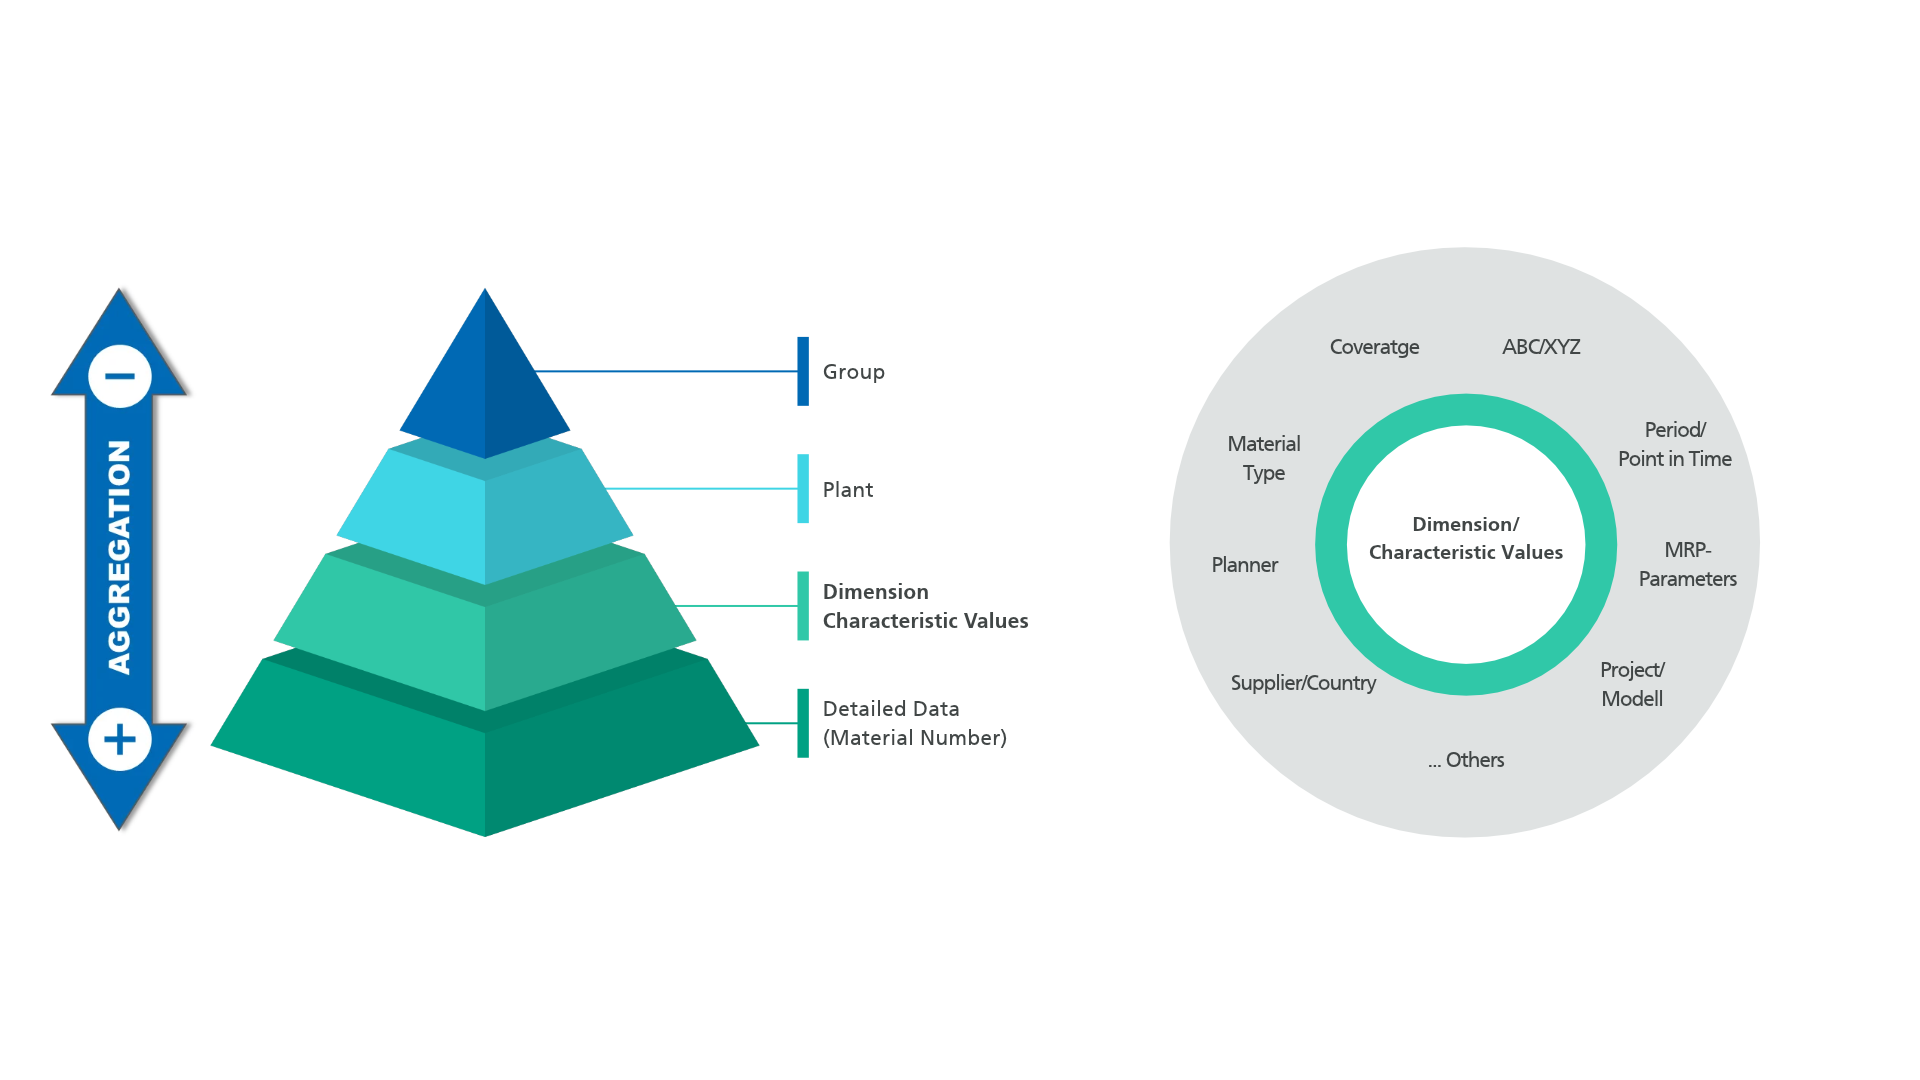
Inventory
Module 1: Transport Cost Management
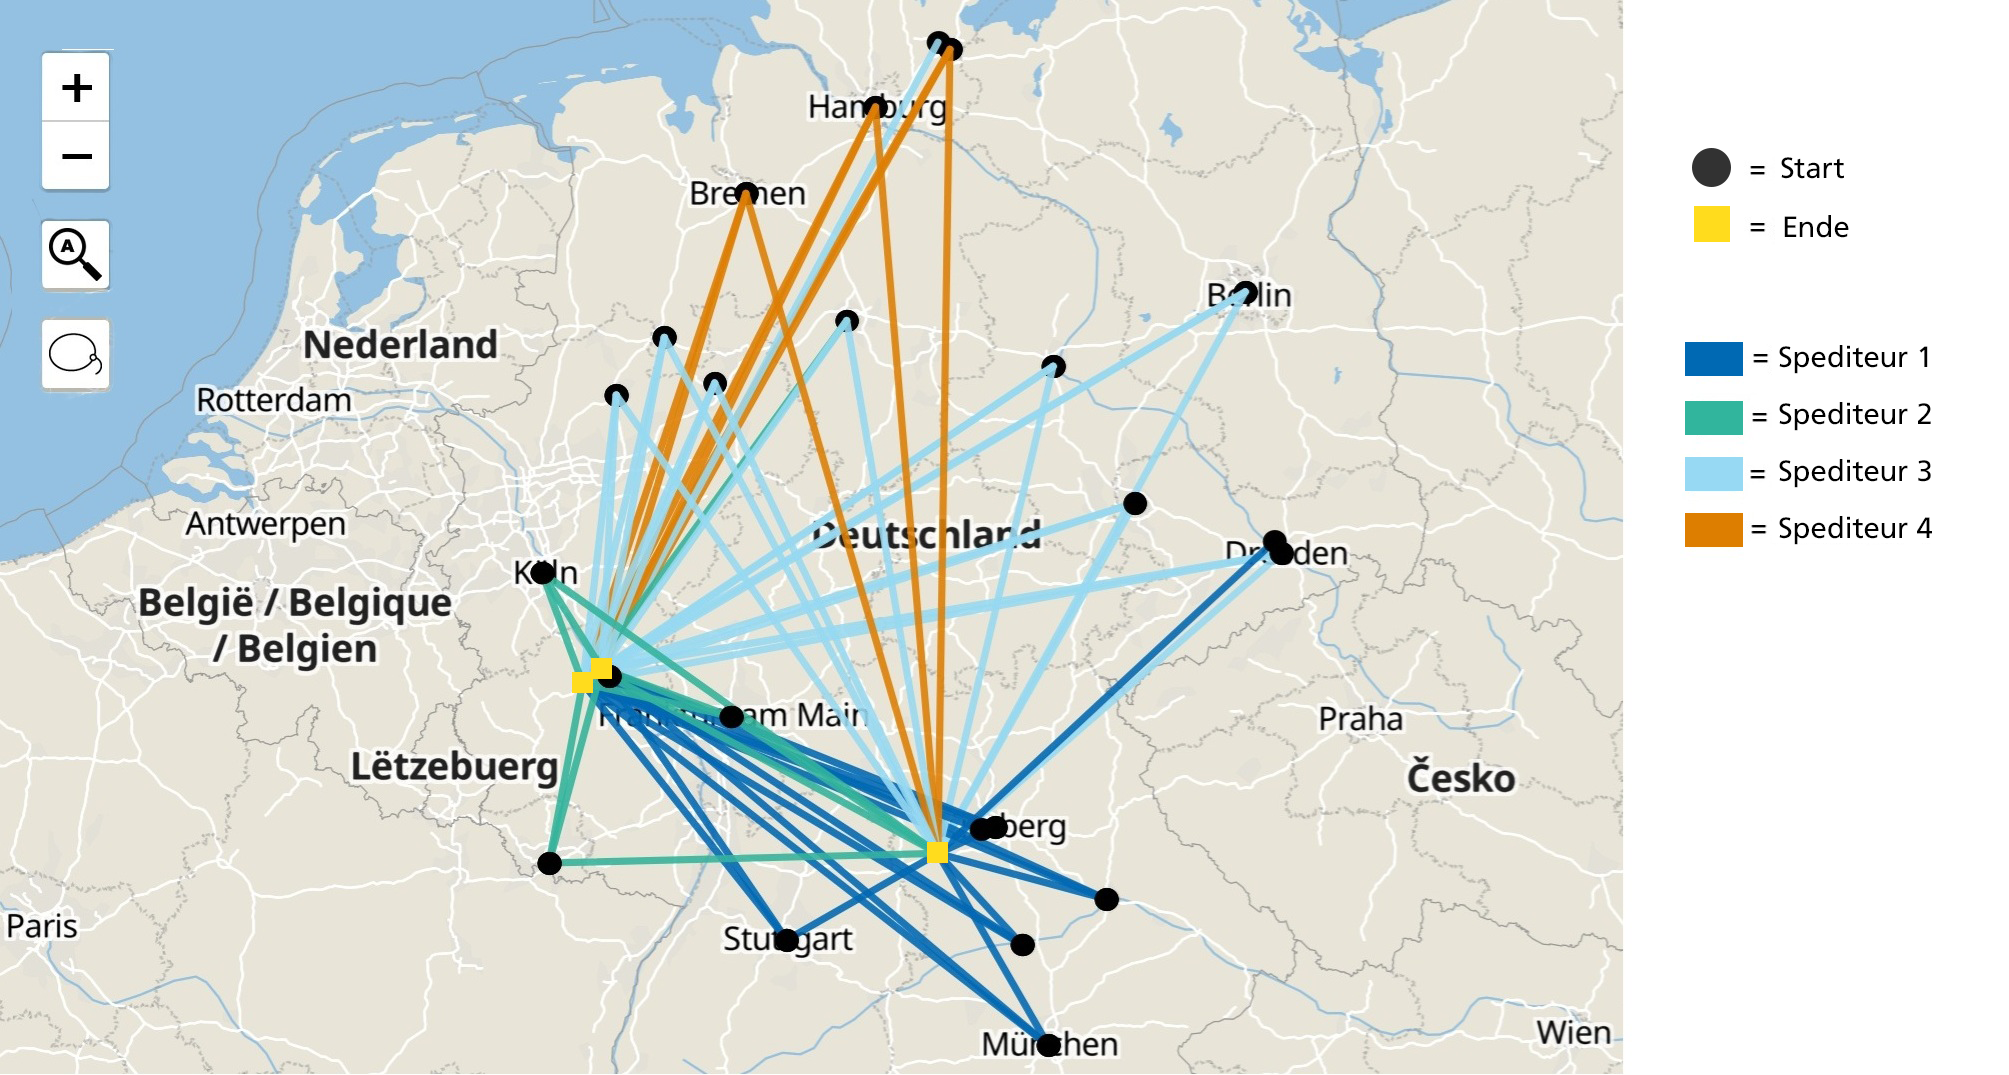
The module uses (existing) transport data provided by your transport service providers (carriers) either electronically or manually. This is where the full power of the tool becomes apparent: transport flows/shipments are visualized in a map-based view with all relevant details, such as frequency, volumes, weights and precise routes, making them directly available for in-depth analysis.
Through the interactive map visualization combined with dynamic table-based overviews, deviations and optimization potential can be quickly identified. This enables companies to recognize interdependencies within their existing transport network and initiate measures that contribute to the optimization and reduction of freight costs in the short term.
Examples of successful customer projects:
- Analysis of 35,000 completed transports across 12 customer locations in Europe (per year)
- Significant reduction in the number of carriers
- Identification of 16% annual savings potential for freight costs within Europe
Module 2: Inventory Management
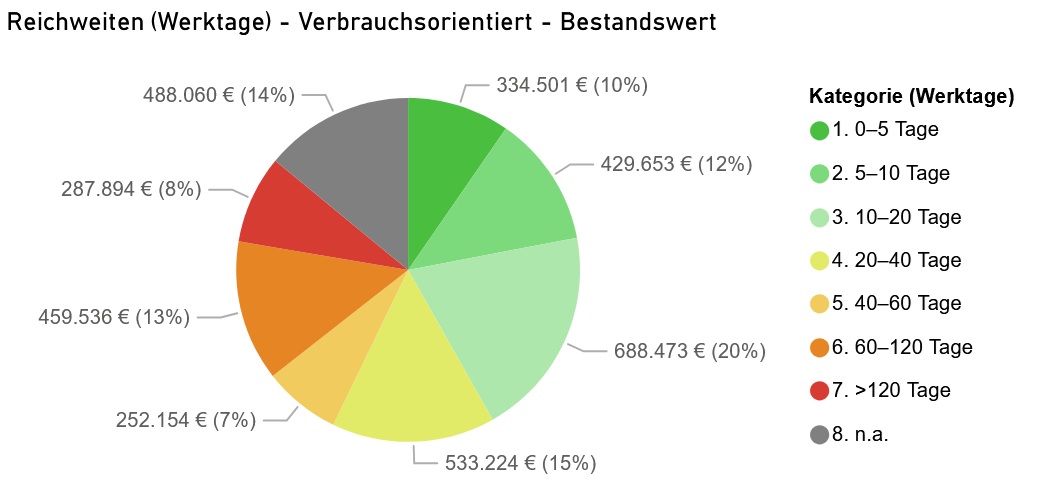
For inventory monitoring and optimization, the current inventory coverage is at least as important a key performance indicator as the absolute inventory value itself. Especially in times of volatile markets and constantly changing conditions, continuous monitoring of this metric and the ability to respond quickly within the supply chain are essential tools for reducing tied-up capital and optimizing inventory turnover.
This module provides all necessary functions to monitor both inventory levels and inventory coverage while quickly identifying deviations. Through dynamic dashboards, data can be visualized across multiple locations or analyzed in detail, from product groups down to individual part numbers. This enables the rapid identification of excess inventory, slow movers or non-movers, providing an initial basis for understanding underlying causes and deriving targeted optimization measures.
Examples of successful customer projects:
- More than 50% inventory reduction within 6 months
- 31% reduction in inventory coverage without production downtime
- Adaptation to market changes: Rapid adjustment of procurement parameters
Module 3: Transport Invoice Audit
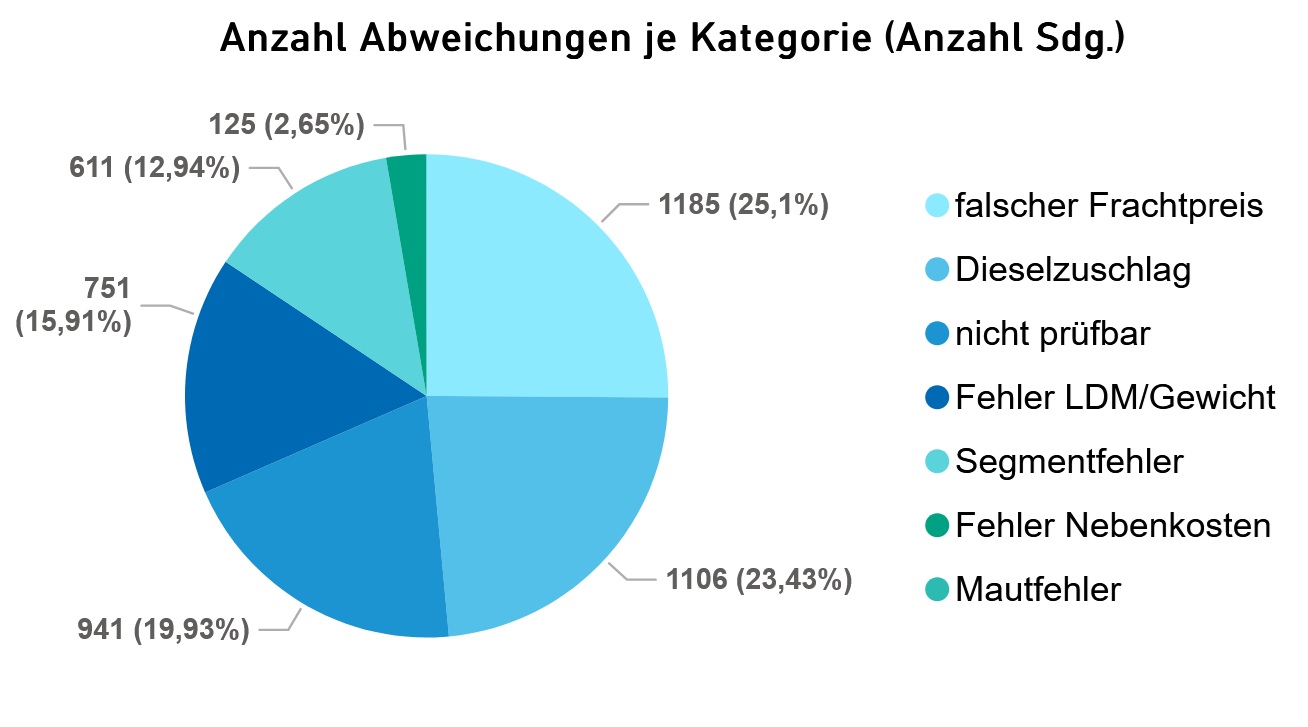
The purpose of this module is to compare transport details with existing price agreements and identify deviations. This enables a detailed, automated review of every transport and invoice without any additional time effort. The identified deviations are visualized via dashboards and prepared for a comprehensive review by your responsible employees.
Even small deviations per transport can result in significant additional costs over the course of a month. These are often not detected today due to missing invoice details and/or the time required for manual checks, or they are only identified at irregular intervals.
Examples of successful customer projects:
- 40% of transport invoices contained errors, resulting in deviations of more than €50,000
- Additional revenue generated through corrected invoice settlements
- Comparison of existing price agreements: Direct cost savings without additional effort